
If you’ve ever wondered why the NIFTY 50 jumps 200 points while your portfolio barely moves—or why your stocks rally but the index remains flat—the answer usually comes down to weightage.
Not all 50 stocks influence the index equally. A small group of heavyweight stocks drives a significant portion of the NIFTY’s movement, while many others have only a minor impact.
On June 12, 2026, the NIFTY 50 closed at 23,369.80, gaining 208.20 points (+0.90%). Using NSE Market Watch data, we analyzed every constituent stock to determine:
- Which stocks carry the most weight in the index.
- How much a stock must move in rupee terms to shift the NIFTY by one point.
The results reveal where the real power inside the index lies.
Understanding NIFTY 50 Weightage
The NIFTY 50 is a free-float market-capitalization-weighted index. In simple terms, larger companies with greater market influence have a bigger impact on index movement.
Understanding weightage helps investors:
- Anticipate likely index direction.
- Explain why their portfolio may outperform or underperform the index.
- Identify concentration risks within sectors and stocks.
- Focus on the stocks that genuinely drive market sentiment.
For this analysis, weightage was estimated using intraday traded value (₹ Crores) as a real-time representation of market influence during the session.
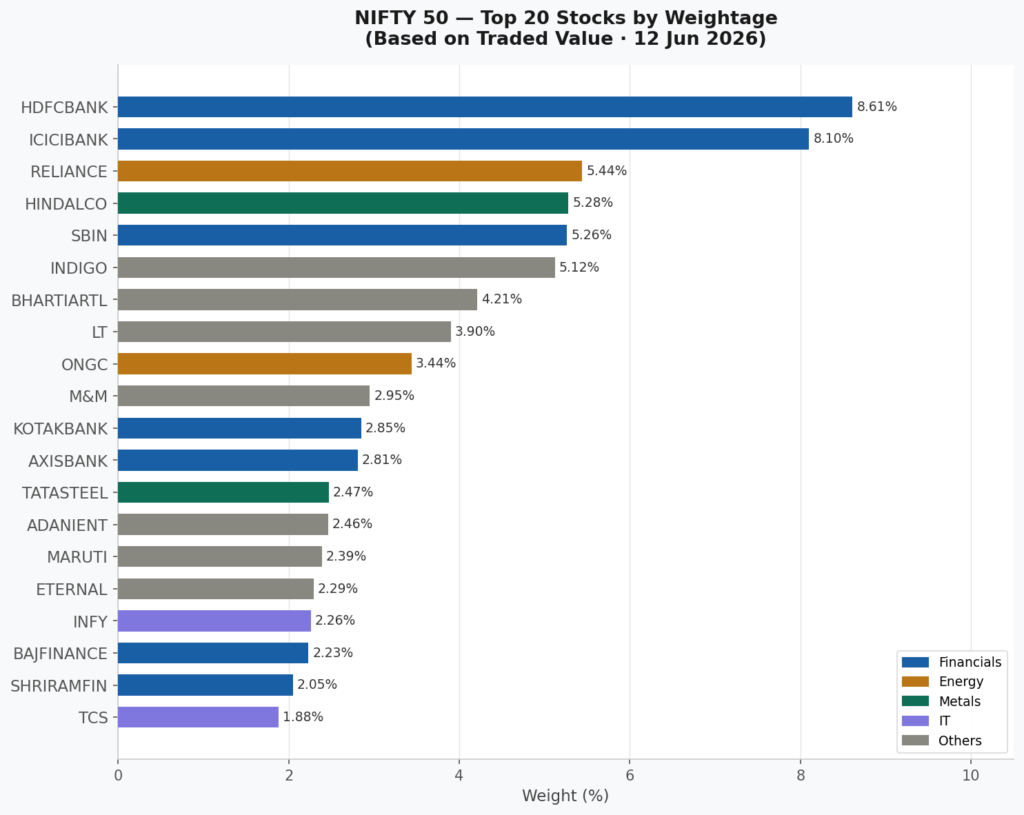
Top NIFTY Heavyweights
The biggest contributors to NIFTY movement on June 12, 2026 were:
| Rank | Stock | Weight (%) |
|---|---|---|
| 1 | HDFCBANK | 8.61% |
| 2 | ICICIBANK | 8.10% |
| 3 | RELIANCE | 5.44% |
| 4 | HINDALCO | 5.28% |
| 5 | SBIN | 5.26% |
| 6 | INDIGO | 5.12% |
| 7 | BHARTIARTL | 4.21% |
| 8 | LT | 3.90% |
| 9 | ONGC | 3.44% |
| 10 | M&M | 2.95% |
What stands out?
HDFC Bank and ICICI Bank alone accounted for 16.71% of total traded weight.
Adding Reliance, Hindalco, and SBI increases the combined influence to 32.69%.
This means that roughly one-third of the index’s daily movement came from just five stocks.
Sector Concentration: Who Really Controls NIFTY?
When grouped by sector, a clear pattern emerges.
Financials — 27.7%
- HDFCBANK
- ICICIBANK
- SBIN
- AXISBANK
- KOTAKBANK
- BAJFINANCE
- SHRIRAMFIN
- JIOFIN
- HDFCLIFE
- SBILIFE
Consumer & Auto — 22.7%
- INDIGO
- M&M
- MARUTI
- ITC
- TITAN
- HINDUNILVR
- ETERNAL
Energy — 10.4%
- RELIANCE
- ONGC
- COALINDIA
Infrastructure & Industrials — 9.5%
- LT
- ADANIENT
- ADANIPORTS
- BEL
- POWERGRID
- ULTRACEMCO
- GRASIM
Metals — 7.7%
- HINDALCO
- TATASTEEL
IT — 7.1%
- TCS
- INFY
- HCLTECH
- WIPRO
- TECHM
Pharma & Healthcare — 3.4%
- APOLLOHOSP
- SUNPHARMA
- CIPLA
- DRREDDY
- MAXHEALTH
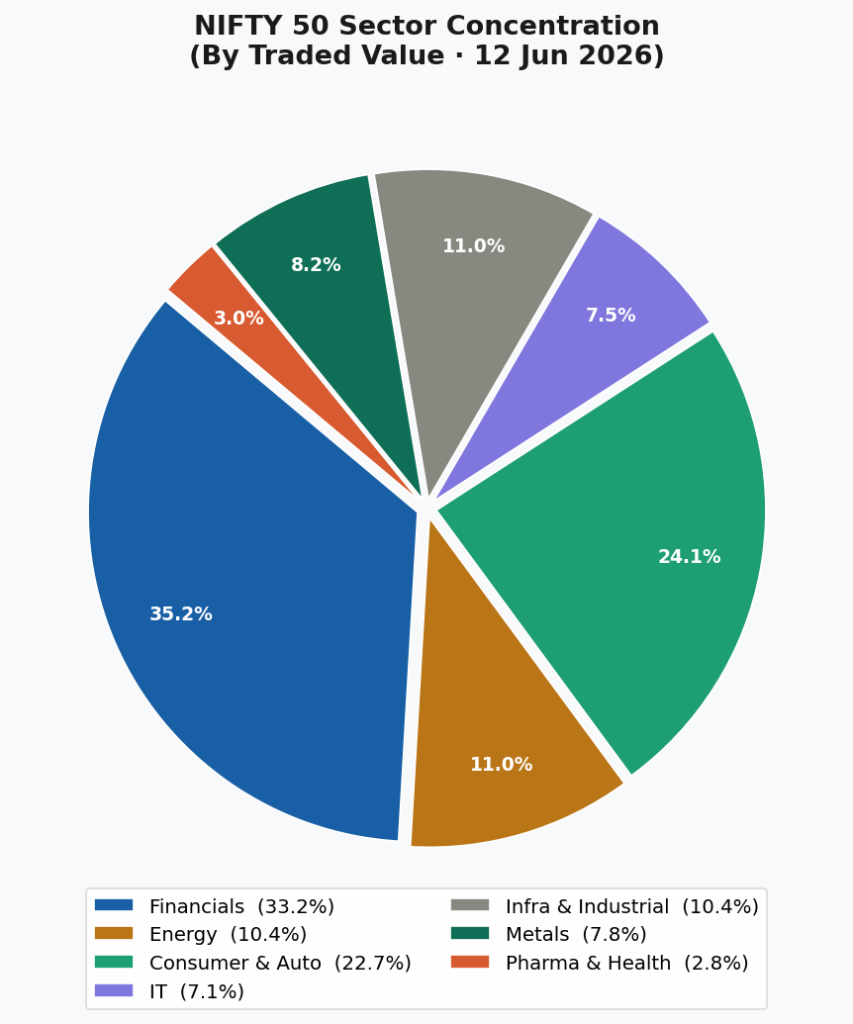
Key Observation
More than one-quarter of NIFTY’s influence comes from financial stocks.
This explains why RBI policy decisions, interest-rate expectations, and banking-sector news often have an outsized impact on the broader market.
The “1 NIFTY Point” Formula
One of the most overlooked concepts among retail traders is understanding how much a stock must move to shift the index.
The approximate relationship is:
Index Contribution ≈ Weight × Stock Movement
Using this relationship, we can estimate the rupee movement required for a stock to move NIFTY by one point.
Stocks That Move NIFTY Most Easily
| Stock | ₹ Needed for 1 NIFTY Point |
| ONGC | ₹0.31 |
| TATASTEEL | ₹0.34 |
| HDFCBANK | ₹0.38 |
| ETERNAL | ₹0.45 |
| KOTAKBANK | ₹0.60 |
| ICICIBANK | ₹0.70 |
| WIPRO | ₹0.73 |
| ITC | ₹0.90 |
Why This Matters
ONGC requires just 31 paise of movement to contribute approximately one NIFTY point because of its high traded value and influence during the session.
HDFC Bank is even more important in practical terms because it combines:
- Large weightage
- High liquidity
- Consistent institutional participation
This makes it one of the most powerful stocks in the index.
Stocks That Need the Biggest Move
At the other end of the spectrum:
| Stock | ₹ Needed for 1 NIFTY Point |
| ULTRACEMCO | ₹96.37 |
| APOLLOHOSP | ₹49.02 |
| EICHERMOT | ₹38.04 |
| BAJAJ-AUTO | ₹26.00 |
| MARUTI | ₹23.58 |
These stocks trade at much higher absolute prices but have lower daily influence relative to heavyweight banking stocks.
The lesson is simple:
Stock price does not determine index power. Weightage does.
The IT Sector Remains Under Pressure
One of the most striking observations from the data is how far major IT stocks remain from their 52-week highs.
| Stock | Below 52-Week High |
| TCS | -38.87% |
| HCLTECH | -37.64% |
| INFY | -35.23% |
| WIPRO | -34.50% |
| TECHM | -22.30% |
The Indian IT sector continues to face:
- Slower global technology spending
- Delayed enterprise AI monetization
- Conservative client budgets
- Weak earnings visibility
While valuations have compressed significantly, investors will closely watch upcoming earnings guidance to determine whether a recovery is justified.